Table of Contents
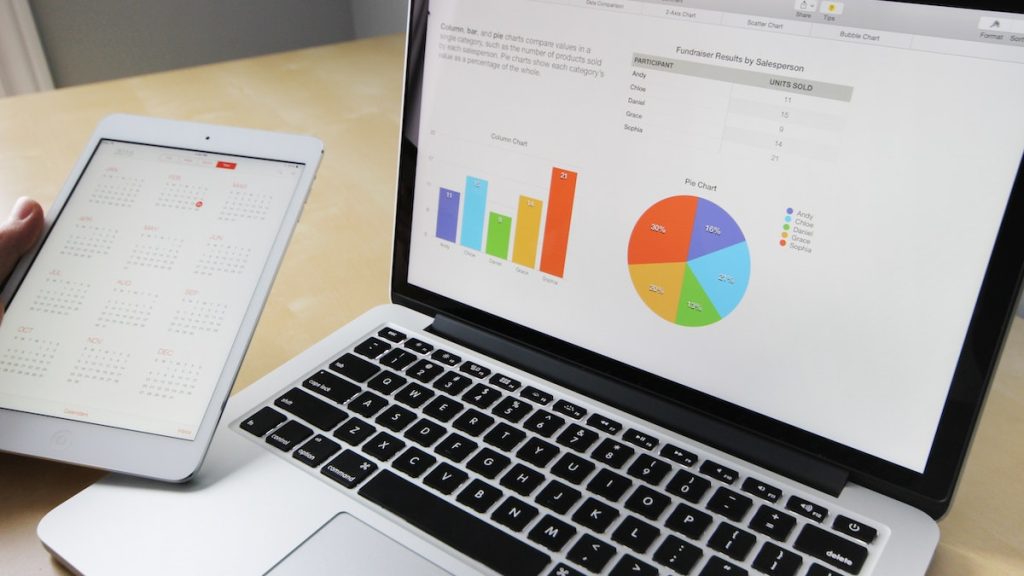
Charts and Graphs are powerful tools for visualizing data and communicating information effectively. Whether you’re an analyst or researcher, or just need to create visuals for a presentation, there are many software options available to help you create stunning and informative graphs and charts. In this article, we will explore the 15 best software for graphs and charts, outlining their key features and benefits.

Microsoft Excel
Microsoft Excel is a widely used spreadsheet software that comes with a robust set of graphing and charting tools. With Excel, you can create basic to complex charts, including bar, line, scatter, and pie charts. You can also customize your charts with various formatting options, such as colors, fonts, and data labels.
Tableau
Tableau is a powerful data visualization tool that allows you to create interactive dashboards and visualizations. With its drag-and-drop interface, you can easily create charts, maps, and other visualizations from your data. Tableau also offers a range of customization options to help you create stunning visualizations.
Google Charts

Google Charts is a free web-based tool that allows you to create a variety of charts and graphs, including line, bar, pie, and scatter charts. It integrates easily with other Google products, such as Google Sheets and Google Drive, and offers a wide range of customization options.
Plotly
Plotly is an open-source data visualization tool that allows you to create interactive charts, maps, and graphs. With its easy-to-use interface, you can create basic to advanced visualizations, including heatmaps, box plots, and 3D plots. Plotly also offers a range of customization options, including color schemes, fonts, and layout options.
D3.js
D3.js is a JavaScript library that allows you to create custom, interactive Google Charts from your data. With D3.js, you can create a range of visualizations, including bar charts, scatter plots, and force-directed graphs. It offers a high degree of customization, allowing you to control every aspect of your visualization.
Adobe Illustrator
Adobe Illustrator is a vector graphics editor that allows you to create high-quality, scalable graphics and charts. With its advanced drawing tools and powerful graphic design capabilities, you can create stunning charts and visualizations for print or digital use.
R
R is a programming language and software environment for statistical computing and graphics. With R, you can create a wide range of visualizations, including scatter plots, line charts, and heat maps. It offers a high degree of customization and controls over your visualizations.
MATLAB
MATLAB is a programming language and numerical computing environment that allows you to create visualizations and data analyses. With MATLAB, you can create basic to advanced visualizations, including 3D plots, histograms, and contour plots. It also offers a range of customization options.
Highcharts
Highcharts is a JavaScript charting library that allows you to create interactive charts and graphs for your website or web application. With its wide range of chart types, including bar, line, and scatter charts, you can create stunning visualizations with ease.
FusionCharts
FusionCharts is a JavaScript charting library that allows you to create interactive charts and graphs for your web applications. With its wide range of chart types, including pie, doughnut, and bubble charts, you can create visually stunning charts and graphs with ease.
Infogram
Infogram is a web-based tool that allows you to create interactive charts and infographics. With its drag-and-drop interface, you can create a range of visualizations, including bar, line, and scatter charts, as well as maps and infographics. It also offers a range of customization options.
Canva
Canva is a web-based design tool that allows you to create a wide range of graphics, including charts and graphs. With its easy-to-use drag-and-drop interface, you can create visually stunning charts and graphs in minutes. Canva also offers a range of customization options, including colors, fonts, and design elements.
Piktochart
Piktochart is a web-based tool that allows you to create infographics and other visualizations. With its easy-to-use interface and templates, you can create visually stunning graphics, including charts and graphs. Piktochart also offers a range of customization options, including colors, fonts, and design elements.
Gephi
Gephi is an open-source software for visualizing and exploring complex networks and graphs. With its advanced visualization tools, you can create complex network graphs, including social network graphs, and explore and analyze your data in real time.
GraphPad Prism
GraphPad Prism is a scientific graphing and data analysis software that allows you to create a wide range of graphs and charts. With its easy-to-use interface, you can create basic to advanced graphs, including scatter plots, line charts, and bar graphs. GraphPad Prism also offers a range of statistical tests and analyses to help you understand and interpret your data.
Professional Charts vs Graphs
Types of data
Charts are typically used to display data that is categorical or qualitative in nature. This means that the data is divided into distinct categories or groups, such as different types of products or regions. Graphs, on the other hand, are used to display data that is numerical or quantitative in nature. This means that the data is represented by numbers or measurements, such as sales figures or population statistics.
Visual representation
Charts typically use bars, columns, pie slices, or other visual elements to represent the data. These visual elements are typically arranged in a way that makes it easy to compare the data across different categories or groups. Graphs, on the other hand, typically use lines, curves, or other visual elements to show how the data changes over time or in relation to other variables.
Purpose
Charts are often used to compare different categories or groups of data and to highlight differences or similarities between them. For example, a bar chart might be used to compare sales figures for different products or regions. Graphs, on the other hand, are often used to show trends or patterns in the data over time or in relation to other variables. For example, a line graph might be used to show how a company’s sales have changed over the past year.
Complexity
Charts tend to be simpler and more straightforward than graphs. They are designed to present data in a clear and concise way that is easy to understand. Graphs, on the other hand, can be more complex and require more analysis to fully understand. This is because they often show more detailed information about the data and how it changes over time or in relation to other variables.
Conclusion
There are many software options available to help you create stunning and informative graphs and charts. Whether you’re an analyst, or researcher, or just need to create visuals for a presentation, the above list of 15 best software for graphs and charts provides you with a range of options to choose from, based on your specific needs and requirements. With these tools, you can create visually appealing and informative graphics that help you communicate your data effectively.


